
Configure the sales focus graph
By default, the sales focus graph shows the amount of sales in all currencies for the month. The amounts are the totals of positive transactions, which are approved debit (DB) and capture (CP) transactions.
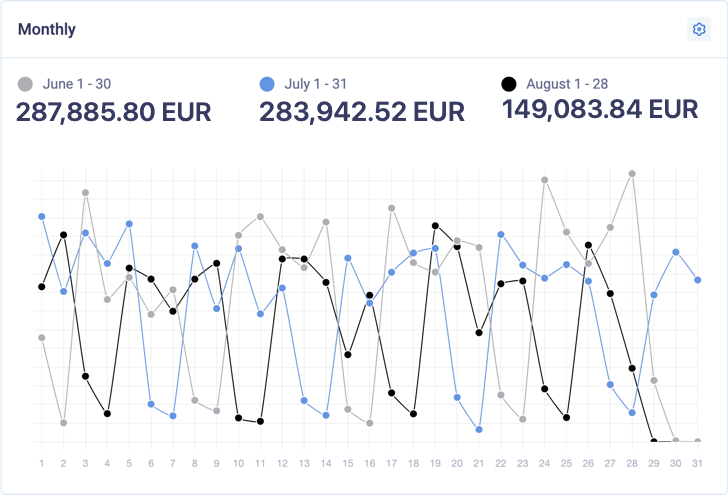
The sales focus graph on the dashboard
To configure the sales focus graph, do these steps. Note that if you only have one option for configuration, a selector will not display.
-
Click the gear button and select settings as follows.
-
For the MID, select one or more merchant account IDs
-
For the Channel, select one or more gateway entities that receive authorisations
-
For Period Comparison, select
Current Period, orCurrent vs Previous MonthorCurrent vs Two Previousto display up to 3 months of data -
For the Period, select
Month to Date(to display this month up to the current date) orMonthly(to display the full month) -
For the Currency, select one or more currency codes
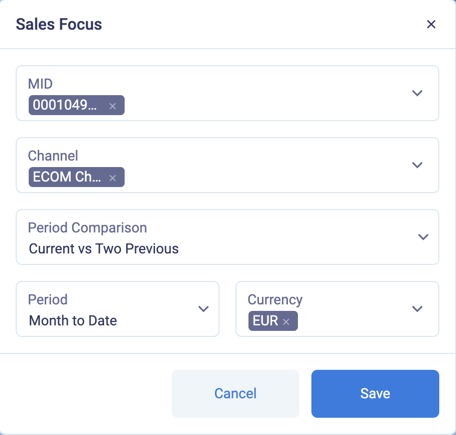
Configuring the sales focus graph
-
-
Click Save
The sales focus graph should now display with the new options.